
The Graphical Method
The graphical method is a simple and intuitive technique used in numerical methods to find an approximate solution to an equation. It is particularly useful for solving equations with a single real root or when we need a quick estimate of the solution.
We first need to plot the function or equation on a graph to use the graphical method. This involves choosing a range of x values, plugging them into the equation, and computing the corresponding values of y or f(x). We then plot these points on the graph and connect them with a line or curve.
The solution to the equation is found by identifying the point where the graph crosses the x-axis. This is done by visually inspecting the graph and looking for the point where the value of the function or equation is zero.
The graphical method is useful because it requires no advanced mathematical knowledge and can be easily understood and applied by anyone. It’s also a visual and intuitive approach that can help us gain insights into the behavior of functions and equations.
However, the graphical method has some limitations. One limitation is that it’s difficult to obtain accurate solutions for equations with multiple roots or complex solutions. This is because it can be difficult to identify the exact point where the graph crosses the x-axis, especially if the graph is not well-behaved or if there are multiple intersections.
Another limitation is that the graphical method is not a reliable method for solving equations that have nonlinear or oscillatory behavior. In these cases, the graph may not intersect the x-axis at all, or it may intersect it at multiple points, making it difficult to identify the correct solution.
Despite its limitations, the graphical method is still a valuable tool in numerical methods. It can be used to gain insights into the behavior of functions and equations, and it can provide a quick and easy estimate of the solution to simple equations.
However, for more complex equations or equations with multiple roots or complex solutions, other numerical methods may be more appropriate, such as the Bisection Method, Newton’s method, or the Secant method. These methods are more reliable and accurate than the graphical method and can be used to solve a wider range of equations.
In conclusion, the graphical method is a useful technique in numerical methods for solving equations that have a single real root or when we need to get a quick estimate of the solution. However, it has its limitations, and more advanced numerical methods may be required for solving more complex equations.
A review on the roots of the equation
The root of an equation is the value or values of the variable where the equation is equal to zero. In other words, it’s the point or points where the graph of the equation intersects the x-axis, which is the line where y=0.
For example, consider the equation
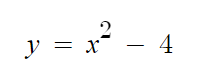
. To find the root of this equation, we set y equal to zero and solve for x:

Therefore, the roots of the equation y = x^2 – 4 are x=2 and x=-2, the points where the equation graph intersects the x-axis.
In general, finding the root of an equation is a common problem in mathematics and has many applications in various fields such as engineering, physics, and finance. The root is an important concept that helps us understand the behavior of systems, model real-world phenomena, and solve problems that involve optimization or finding the best solution.
What is the procedure for Graphical Method?
- Start with an equation that you want to solve, such as f(x) = x^2 – 4x – 5.
- Choose a range of x values to plot on the graph. You want to choose enough values to get a good idea of what the graph looks like, but not so many that it becomes difficult to plot them. For example, you might choose x values from -5 to 5 in increments of 1.
- Plug each x value into the equation to find the corresponding y value. For example, if x = 1, then f(1) = 1^2 – 4(1) – 5 = -8.
- Plot each point (x, y) on the graph.
- Connect the points with a smooth curve. This will give you the graph of the equation.
- Identify the x-intercepts of the graph. These are the points where the graph intersects the x-axis, which corresponds to the roots of the equation.
- Check your solution by plugging in the x-values of the x-intercepts into the original equation to make sure that they satisfy the equation and are true roots.
Examples
Using graphical method find the roots of
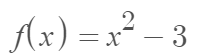
Step 1: Determing the problem.
Step 2: Choose a range of x values to plot on the graph. You want to choose enough values to get a good idea of what the graph looks like, but not so many that it becomes difficult to plot them. For example, you might choose x values from -5 to 5 in increments of 1..
| x | -5 | -4 | -3 | -2 | -1 | 0 | 1 | 2 | 3 | 4 | 5 |
| f(x) |
Step 3: Plug each x value into the equation to find the corresponding y value
| x | -5 | -4 | -3 | -2 | -1 | 0 | 1 | 2 | 3 | 4 | 5 |
| f(x) | 22 | 13 | 6 | 1 | -2 | -3 | -2 | 1 | 6 | 13 | 22 |
Step 4: Plot each point (x, y) on the graph.
Step 5: Connect the points with a smooth curve. This will give you the graph of the equation
Step 6: Identify the x-intercepts of the graph. These are the points where the graph intersects the x-axis, which corresponds to the roots of the equation.
Step 7: Check your solution by plugging in the x-values of the x-intercepts into the original equation to make sure that they satisfy the equation and are true roots.

From the graph above, what do you think is the roots of the equation.
REMEMBER: The roots are where the graph intercepts the x-axis or where y=0.
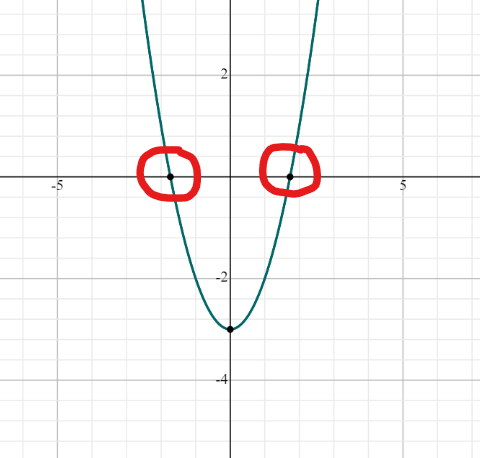
So based on the graph above, the roots are somewhere between x=-1 and x=-2, and between x=1 and x=2. In this case, there are two roots. There are cases where there is only one root, or cases with multiple roots
The larger your graph will be, the more accurate your root approximation.
REMEMBER: Numerical Methods is only an APPROXIMATION.
In this case, the limitation of approximation is based on the size of the graph and the clarity of the eyes of those who will interpret the graph.
Exercises
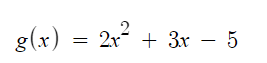
Find the roots of the following using graphical methods.
1.

2.
Quiz
Using graphical methods, find the roots of the following:
